Success Story: Operational Transformation Through Data-Driven Dashboards
📊Industry: Cement Manufacturing
890
Users Trained
Adoption+30
Dashboards in Use
System Effectiveness98%
Reports Automated
Operational Efficiency1. Context and Objective
Over the past decade and a half, I have led and implemented advanced industrial analytics platforms for the cement sector. My role has focused on transforming fragmented plant data into real-time intelligence systems—integrating KPIs across energy, maintenance, logistics, production, and cost areas. This project was born out of the need for visibility and performance consistency across cement plants operating under variable loads, energy peaks, and aging infrastructure.
The primary objective was to design and implement an integrated dashboard solution that could centralize operational indicators from various sources—maintenance, production, energy, stock, and cost management—into a single, user-friendly interface. This initiative aimed to facilitate data-driven decision-making, enhance visibility of plant performance, and promote proactive management of resources and operational risks.
2. Identified Challenges
Before the implementation, the company operated with siloed systems, where departments used independent Excel files, disconnected ERPs, and manual data entry processes. This fragmented approach made it difficult to obtain accurate, real-time data, often leading to delays in decision-making and inefficiencies in resource allocation.
Key challenges included:
- Lack of visibility over energy consumption patterns and power factor fluctuations.
- Difficulty in tracking maintenance KPIs such as MTTR, MTBF, and backlog levels across multiple equipment types.
- Inefficient inventory management due to disconnected warehouse data and limited forecasting tools.
- Inconsistent monitoring of preventive versus corrective maintenance actions.
- Absence of a unified cost control mechanism for maintenance and energy expenditures.
Future Impact Projection: Cost Reduction & Efficiency Trends
3. Implemented Solution
The approach began with a thorough diagnostic of current workflows and a detailed requirements-gathering phase across operational, maintenance, and energy departments. Following a lean Six Sigma framework, the strategy emphasized identifying high-impact KPIs and designing standardized visualization models tailored to each user level—from operators and supervisors to plant managers and corporate executives.
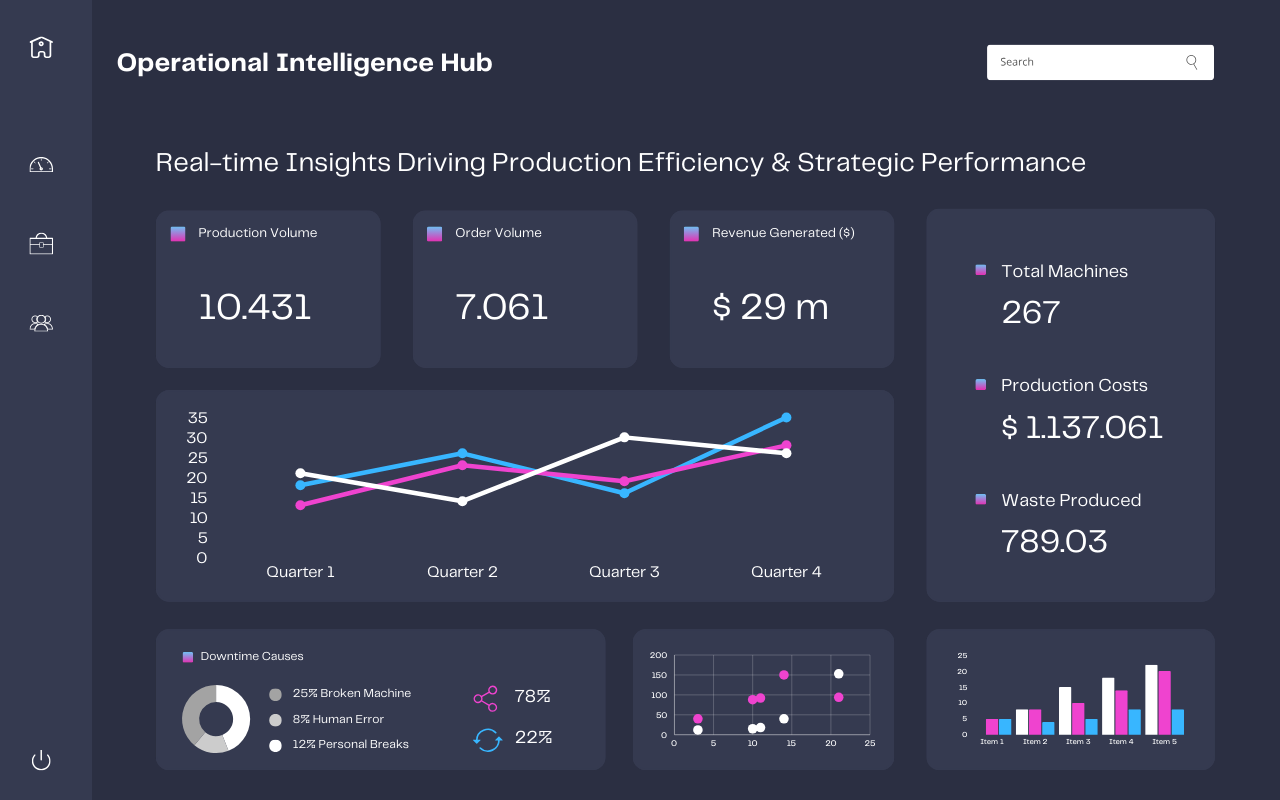
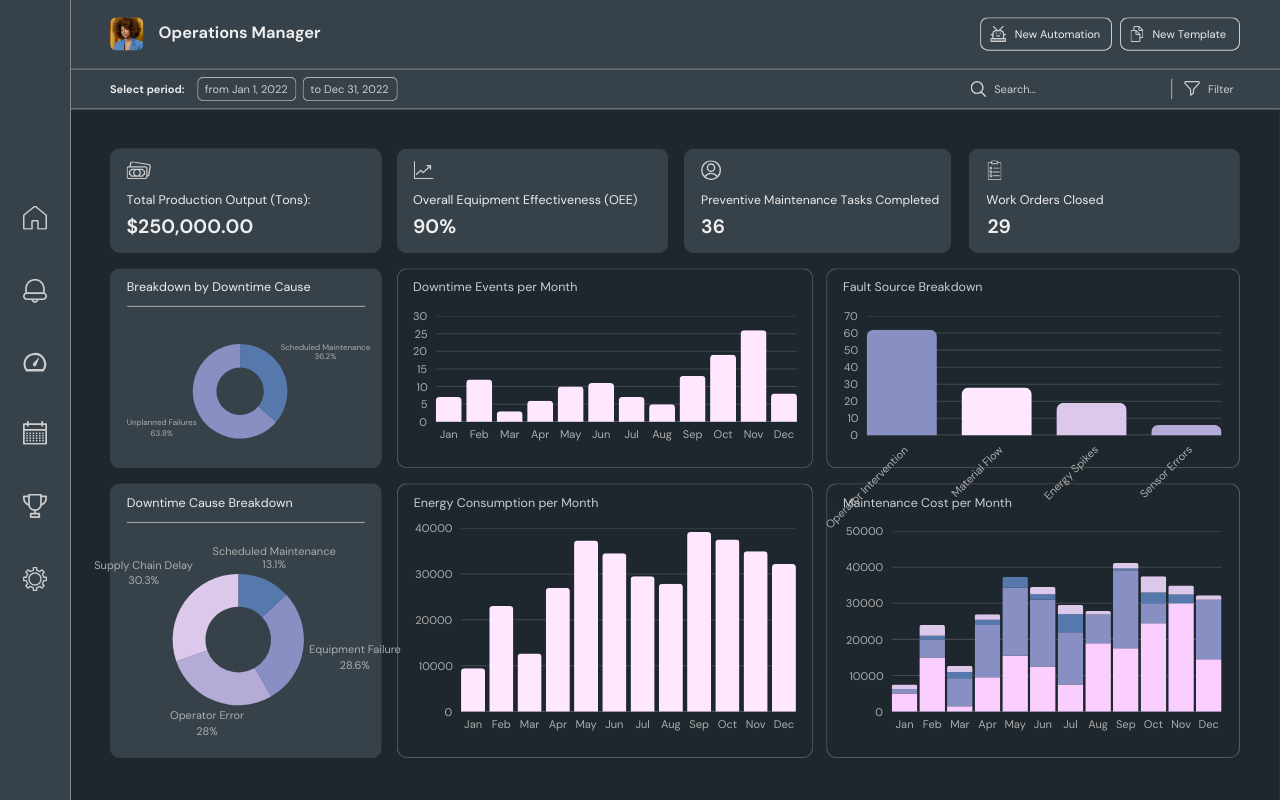
The core of the solution was a suite of over 30 interconnected dashboards developed using business intelligence tools and custom ETLs. These dashboards were designed to pull data from multiple sources (ERP, SCADA, CMMS) and present it in a modular, intuitive format. Key functionalities included drill-down capabilities, dynamic time filters (daily, monthly, quarterly), and plant-specific custom views. Automation replaced manual reporting, reducing human error and saving time.
This data model allowed real-time tracking of energy loads, maintenance effectiveness, stock movements, cost deviations, and production performance, all aligned under a unified visual identity to ensure usability across teams.
4. Key Visualizations and Metrics
The dashboard suite incorporated critical operational and technical KPIs that addressed all key performance areas:
- Technical Indicators: Mean Time To Repair (MTTR), Mean Time Between Failures (MTBF), and Equipment Availability by plant and production line.
- Energy Consumption: Load diagrams by minute, day, and month, Power Factor trends, and consumption per ton of cement produced (KWh/TM.CEM).
- Backlogs and Shutdowns: Visual tracking of corrective, preventive, and emergency maintenance orders, including downtime hours and pending work orders.
- Maintenance Cost Efficiency: Monthly and cumulative maintenance costs per ton of production, segmented by type (electrical, mechanical, preventive).
- Inventory and Stock Management: Material flow (entry/exit), stock levels by warehouse and material type, alerts for low stock, and evolution of availability versus forecasted demand.
- Organizational KPIs: Performance by workshop and process, rework rates, compliance with preventive maintenance schedules, and workforce utilization (HH).
- Energy and Cost Allocation: Comparative charts for energy consumption with and without production, variable cost per plant, and monthly budget compliance trends.
5. Results Achieved
Following implementation, the cement producer experienced measurable improvements in operational transparency and efficiency. Maintenance performance improved significantly, with a 20% reduction in average MTTR and a 15% increase in MTBF across critical equipment. Preventive maintenance compliance rose to over 90%, and backlog management improved due to early warnings and visual alerts.
Energy management was another major win. Power factor fluctuations were minimized, helping avoid penalty charges and improving sustainability metrics. The visibility of energy consumption by process and equipment helped optimize shifts and load balancing, ultimately leading to a 12% reduction in energy usage per ton of cement.
Inventory optimization led to a 25% decrease in material shortages, while cost visibility enabled better procurement planning and reduced emergency purchases. With centralized dashboards, monthly review meetings became data-driven, reducing decision-making times and enhancing cross-functional collaboration.
6. Strategic Impact
The success of the dashboard system extended beyond operational gains. Strategically, the solution empowered plant leadership to adopt a culture of continuous improvement, where real-time performance monitoring replaced reactive firefighting. The unified view of KPIs across functions broke silos and promoted accountability at all levels.
The dashboards also served as a strategic planning tool. Executives could simulate the impact of planned maintenance activities or energy policy changes, enabling more informed CAPEX and OPEX decisions. The platform became a foundation for future digital transformation projects, including predictive maintenance and AI-driven demand forecasting.
Furthermore, the solution aligned with the company’s sustainability goals, supporting more responsible energy use and resource allocation—an increasingly critical differentiator in the cement industry.
7. Conclusions and Lessons Learned
This case highlights the transformative power of integrated data systems in industrial environments. By combining operational insight with actionable visualizations, the cement producer was able to modernize its management culture and gain a competitive edge.
Key takeaways include:
- Early stakeholder engagement and cross-departmental collaboration are essential for adoption.
- Simplicity in dashboard design increases usage and long-term sustainability.
- Real-time visibility reduces operational risks and enhances agility in response to anomalies.
- Modular dashboards allow easy scalability and integration with future technologies.
Categories
Dashboards