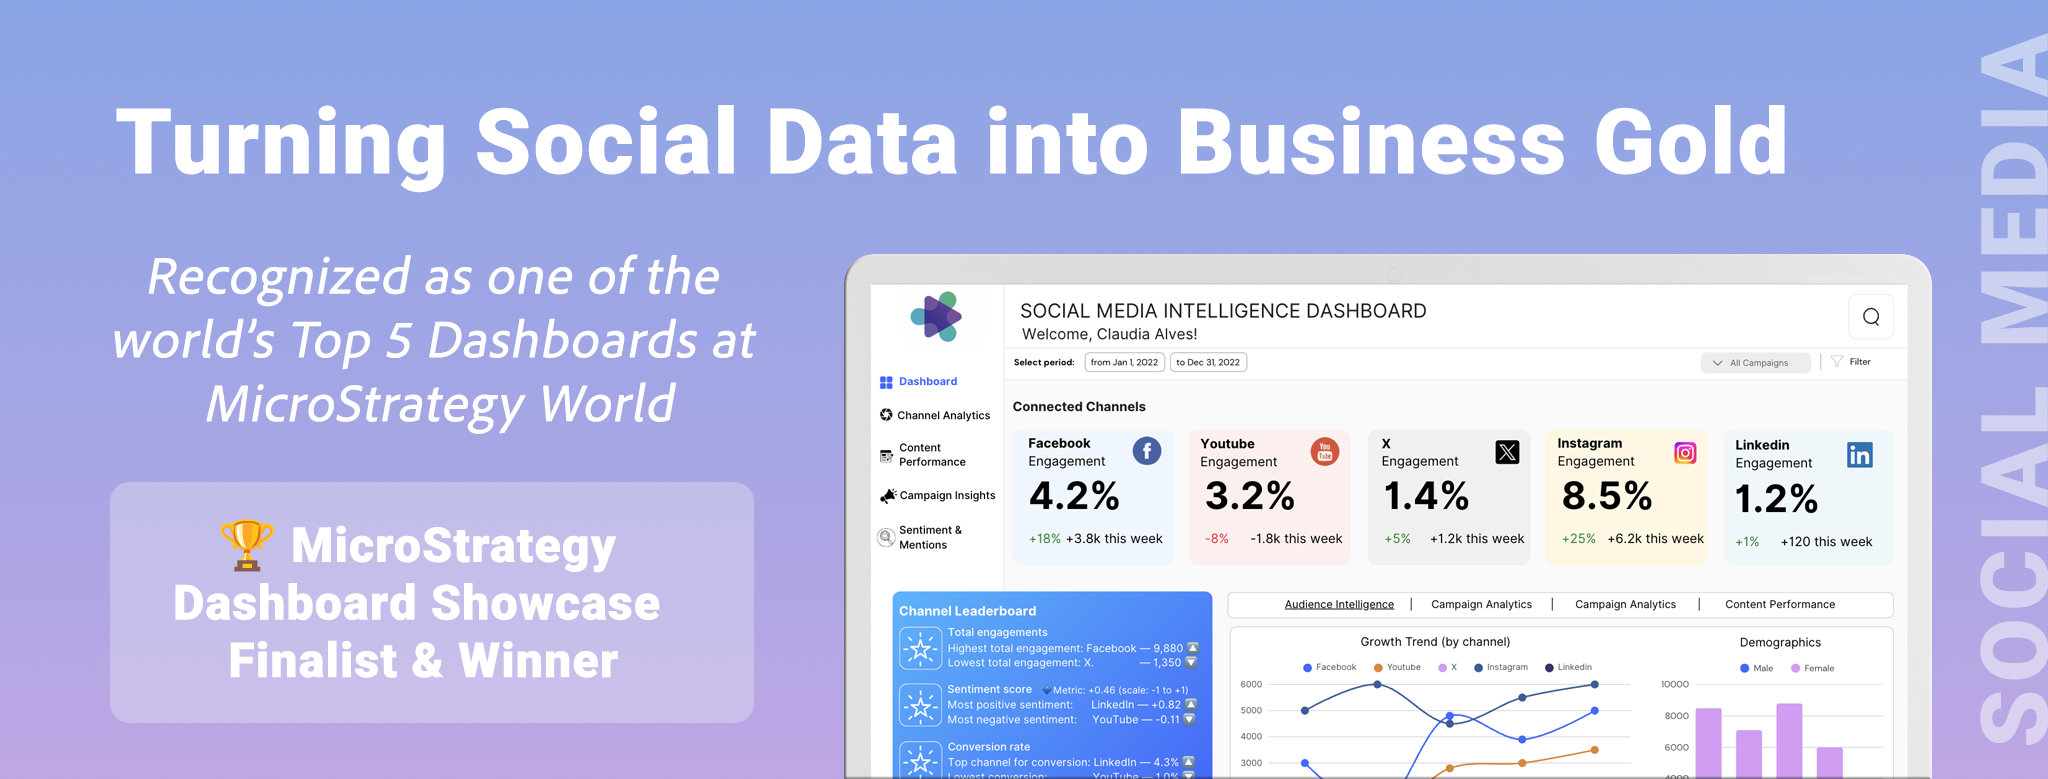
MicroStrategy Dashboard Showcase Finalist & Winner
Behind the scenes of the award-winning Social Media Intelligence Dashboard recognized at MicroStrategy World 2016
A Bit of History
A question I’ve been asked constantly since receiving the MicroStrategy award in 2016 is: What was so special about that dashboard?
The truth? It was simpler than most people think. But there is art in simplicity, especially when you're dealing with complexity behind the scenes. And that complexity began years earlier.
It was 2011. By then, data had already become my daily bread. I was immersed in analytics and fascinated by how numbers could shape real-world decisions. Meanwhile, social media was exploding. Facebook was booming, and marketers were trying to figure out how to harness its influence.
That’s when Facebook released the Graph API. With it, developers could access structured, rich social data: profiles, posts, connections, reactions. It was a window into real-time behavior. I knew this was something big.
At the time, MicroStrategy had just started experimenting with social connectors, but they weren’t accessible for every budget. So we set out to build our own tools. We didn’t just rely on one platform either—we developed custom ETLs to extract and normalize data from Facebook, Twitter, YouTube, Google+, and Instagram, combining them with internal enterprise data sources.
We were pioneers in this space in Peru. Almost no one else was doing this. And that’s how the seed of our dashboard was born.
Turning Social Conversations into Strategic Intelligence
We envisioned a dashboard that wouldn't just show metrics, but offer campaign intelligence: how people were reacting, which platforms performed better, what time of day yielded the highest engagement, and how it all tied to sales, leads, and brand performance.
We weren’t building a dashboard. We were building a bridge between external sentiment and internal KPIs.
And we wanted it to run on MicroStrategy. With its speed, in-memory cubes, and dashboard flexibility, it was the perfect BI engine to bring our vision to life.
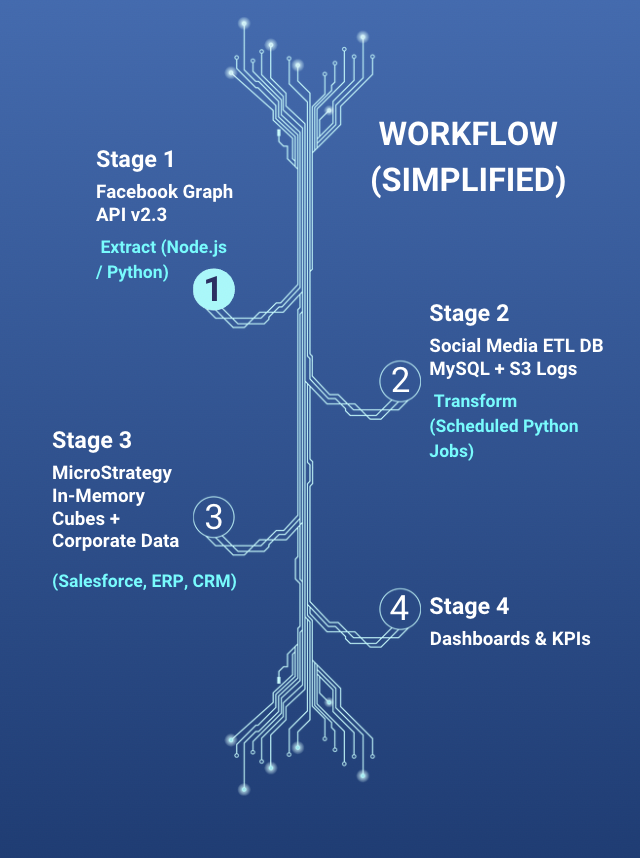
⚙️ The Architecture (Simplified)
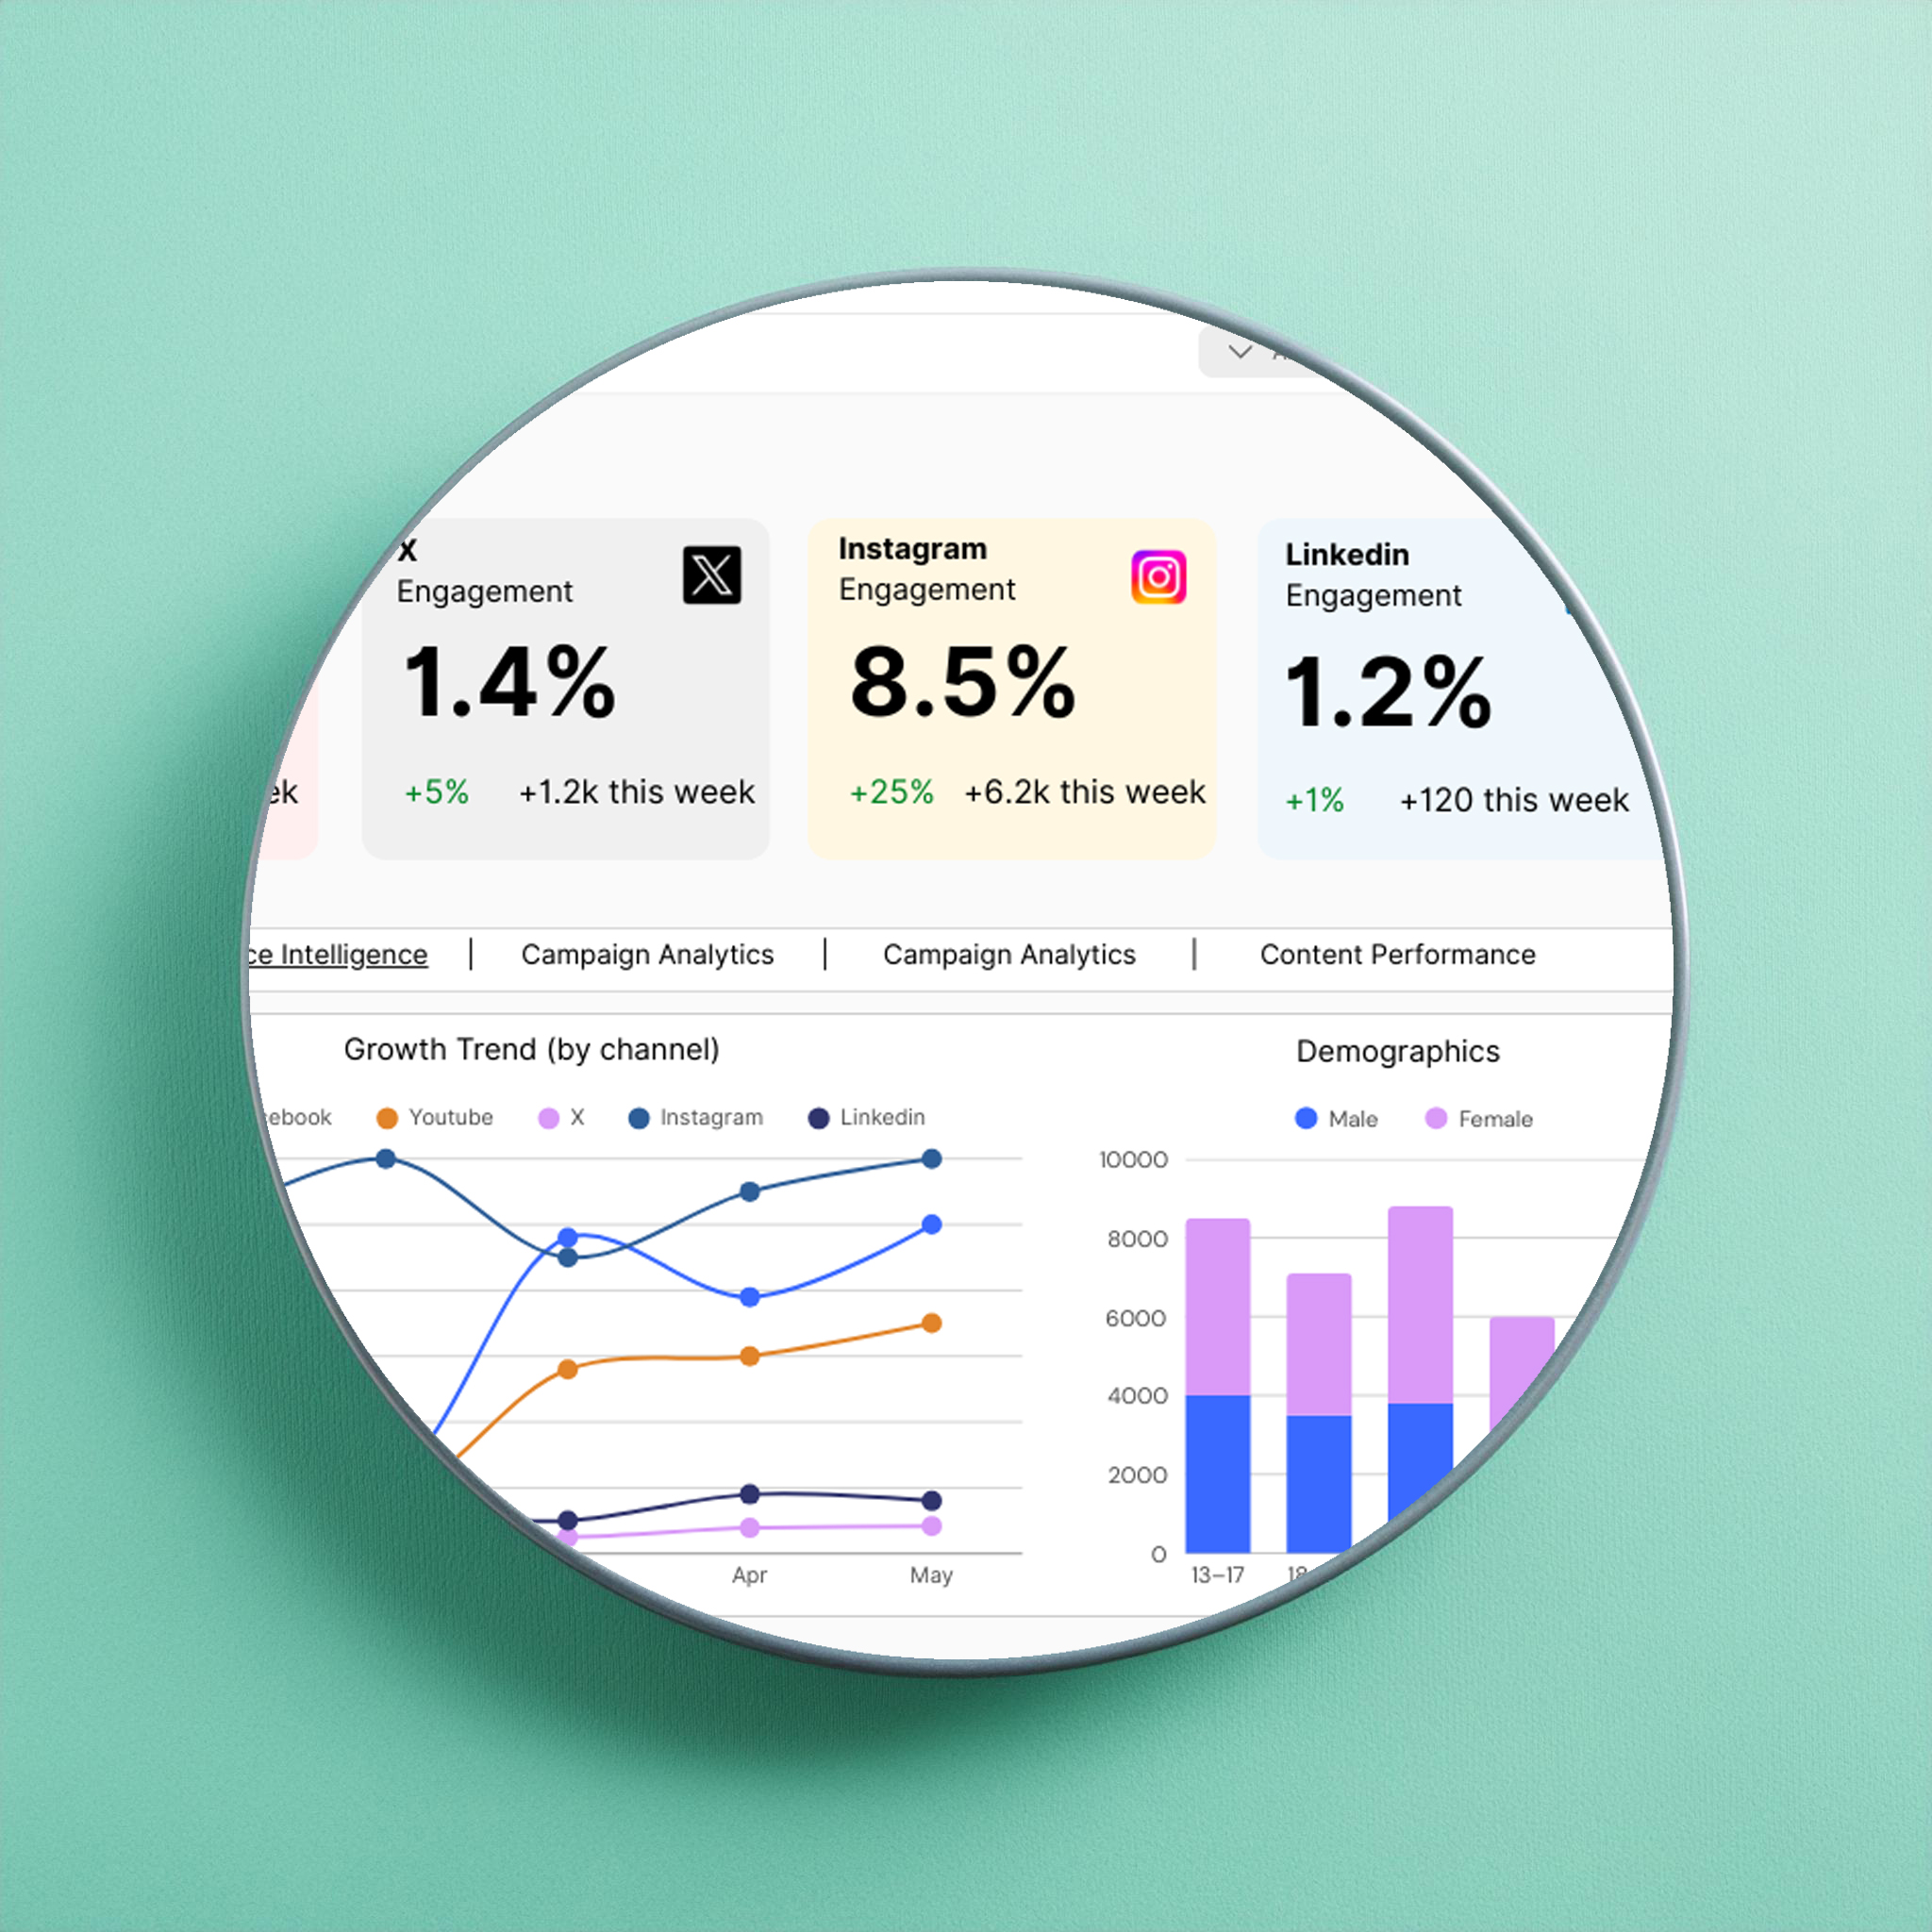
We treated social channels like business units. We compared them in terms of reach, engagement, audience growth, and even sentiment. We visualized KPIs like:
- Total Reach and Engagement
- Best/Worst Performing Channels
- Post-Level Metrics (likes, comments, shares, CTR)
- Time-Series Growth by Platform
Everything was filterable by region, campaign, product, or influencer.
Dashboard Design Principles
The winning dashboard wasn’t flashy. It was strategic:
- Minimal UI – so nothing distracted from the data
- Segmented by user type – marketers, execs, analysts
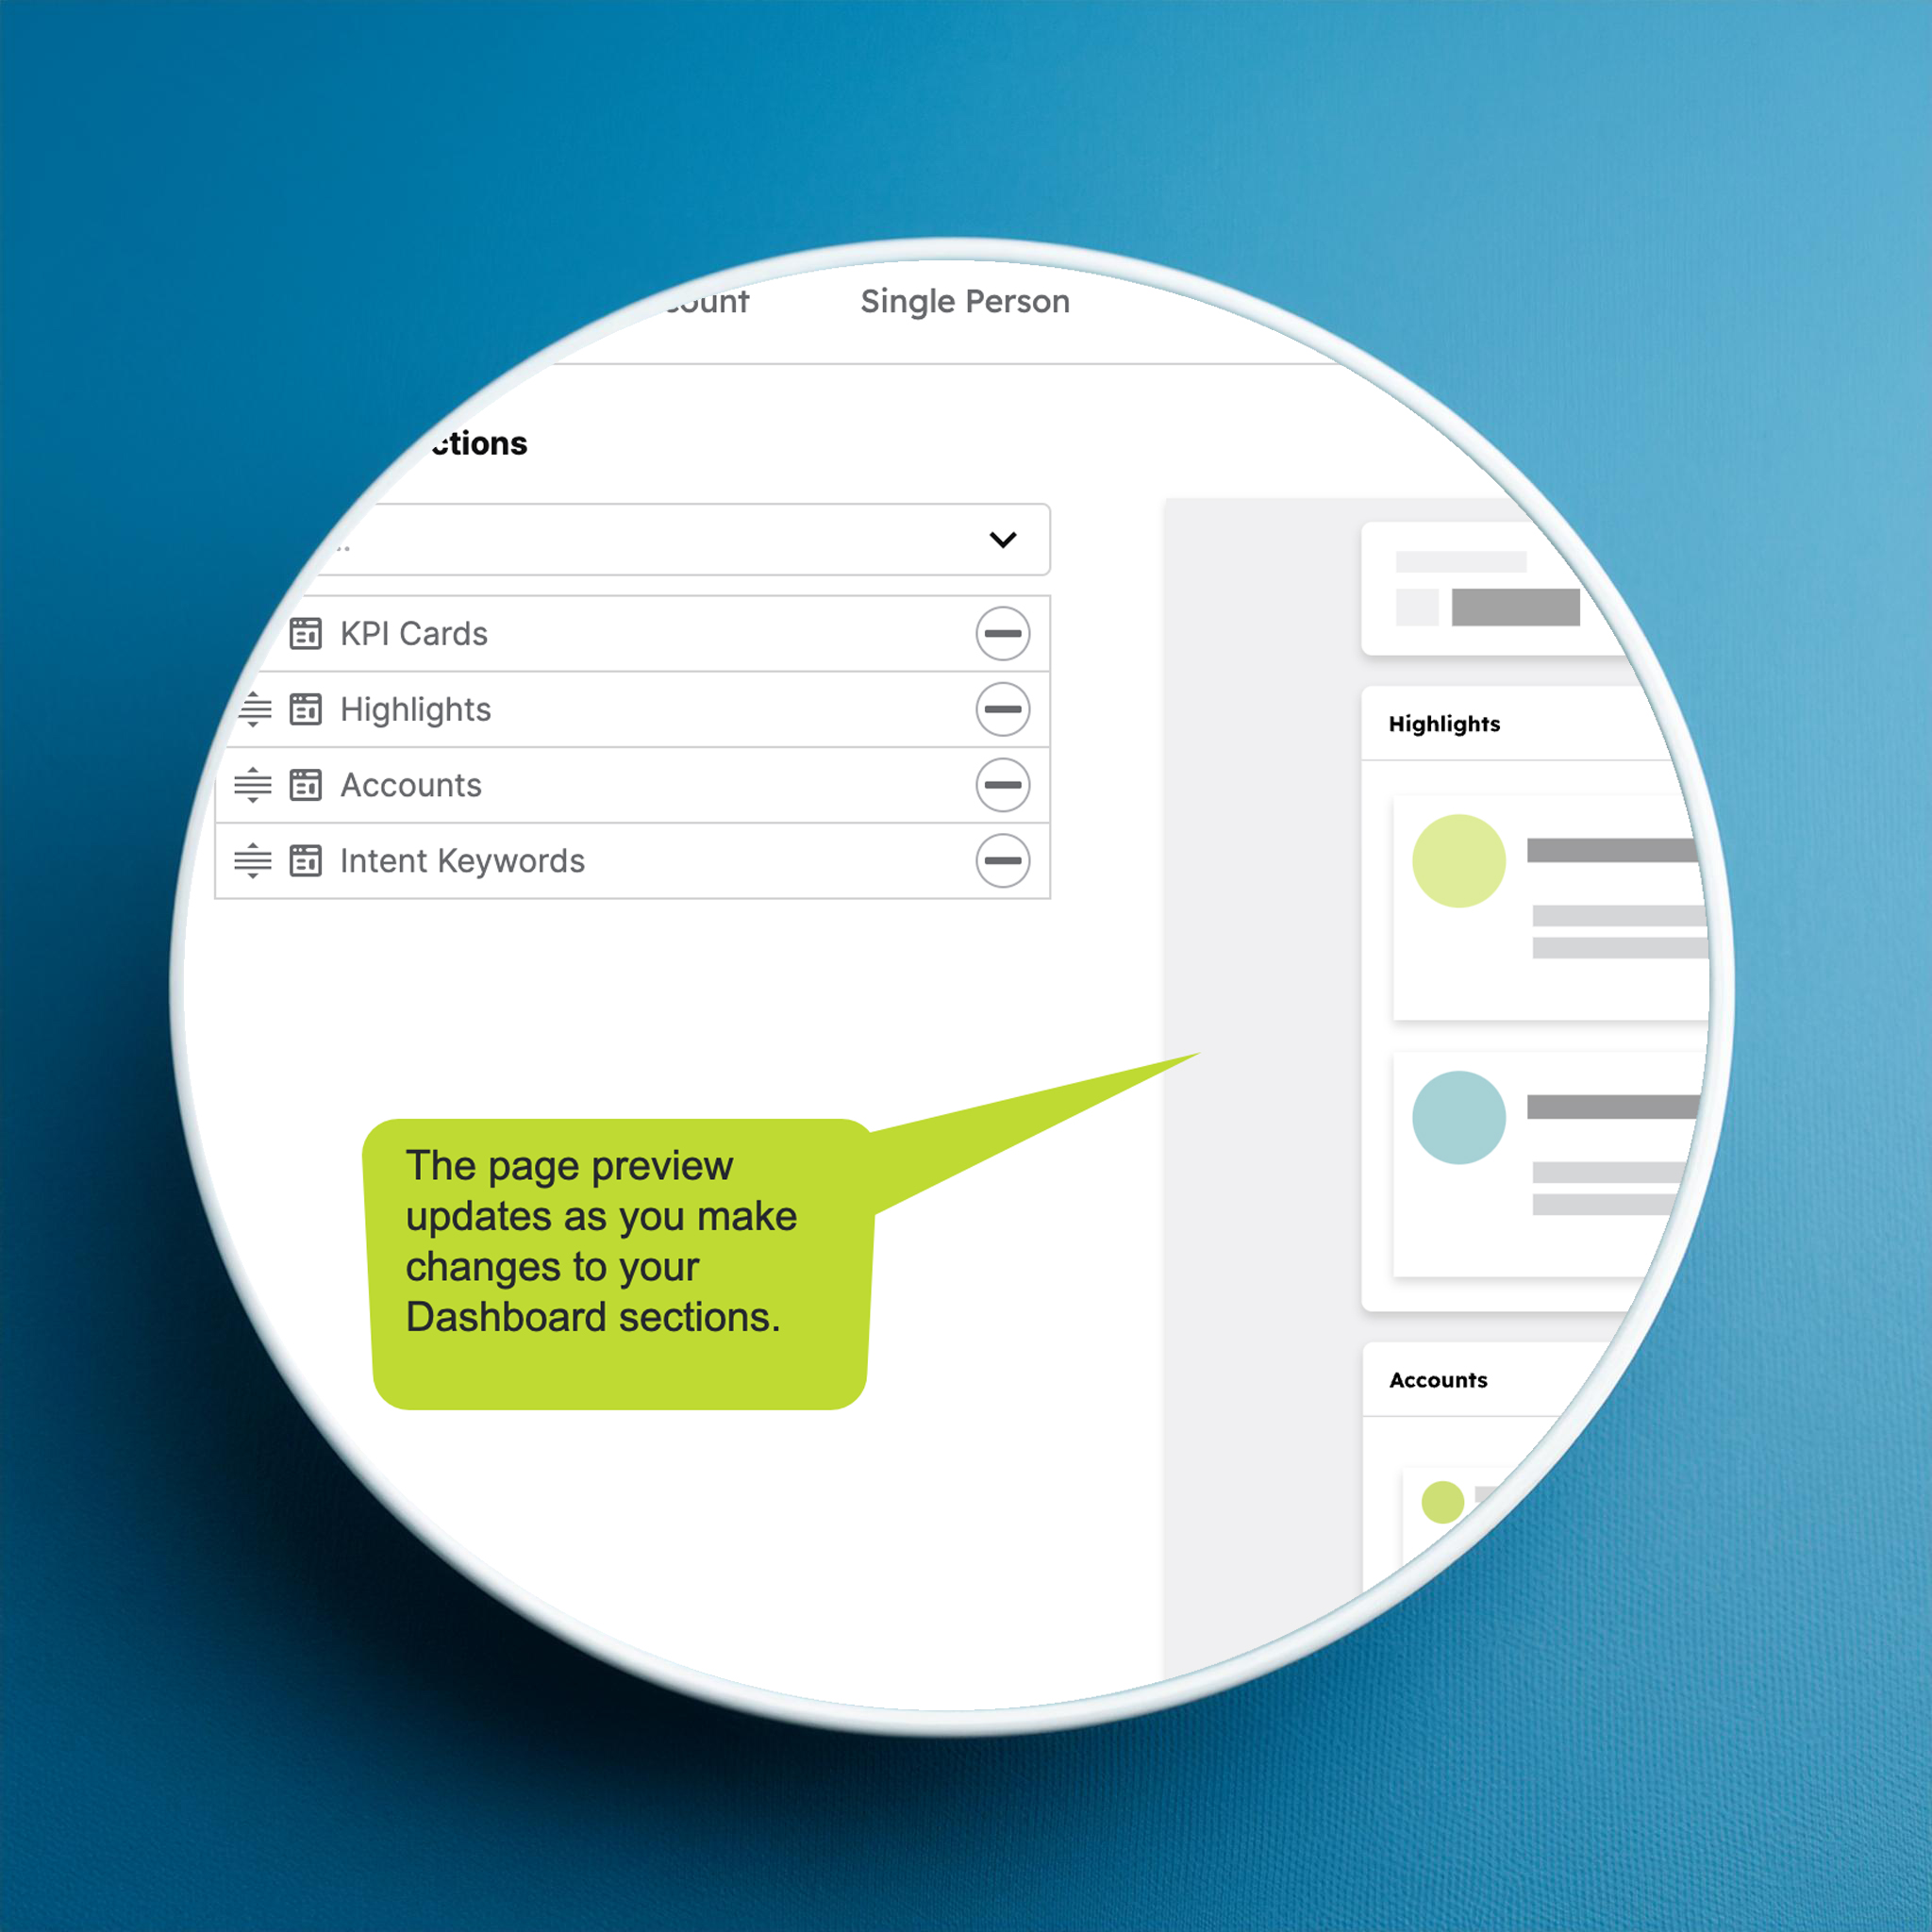
- Customizable – with dynamic selectors and adaptive grids
Every element was interactive, responsive, and purpose-driven. It combined storytelling with clarity and analytical strength.

Award-Winning Moment
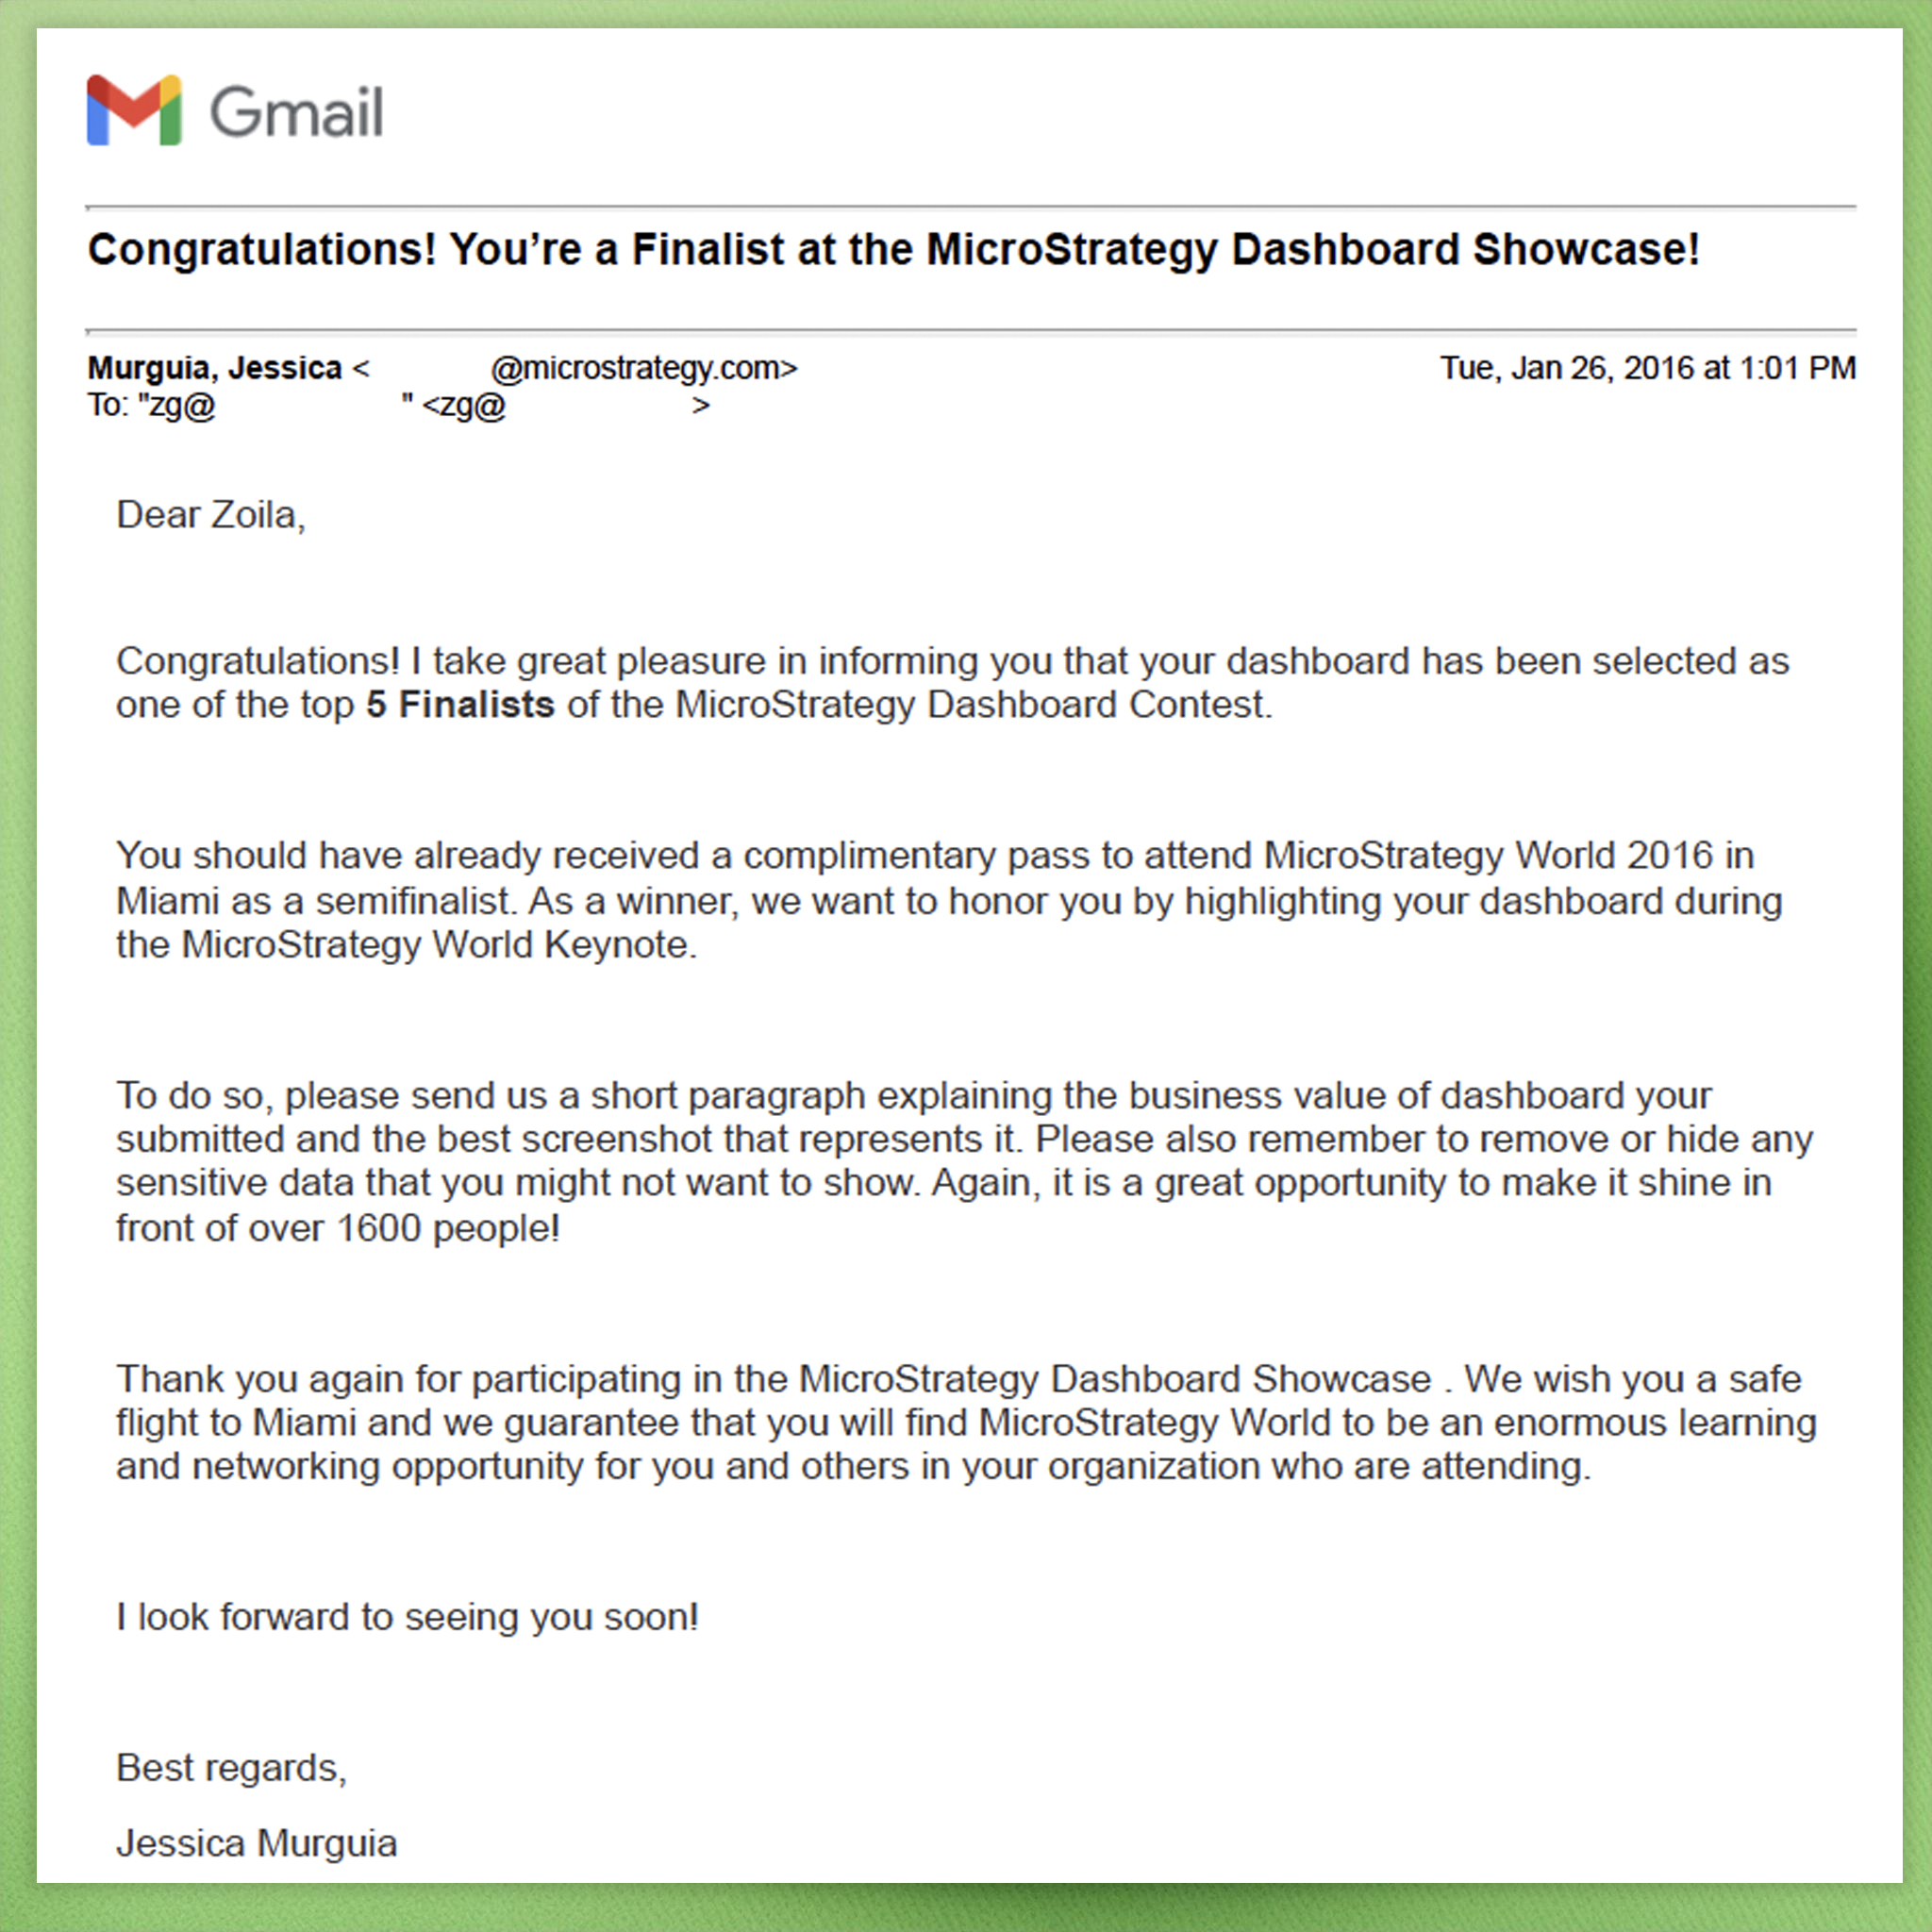
In January 2016, I received an email from MicroStrategy:
"Congratulations! I take great pleasure in informing you that your dashboard has been selected as one of the Top 5 Finalists of the MicroStrategy Dashboard Contest. We want to honor you by highlighting your dashboard during the MicroStrategy World Keynote."
I still remember walking into the Showcase Hall. Giant screens, brilliant developers from across the globe, and thousands of hours of BI work on display. And there it was—our dashboard, built from scratch, powered by custom APIs, standing proudly among the world’s best.
We weren’t a global consultancy. We were a Peruvian team with a vision and a relentless belief that data could be more.
Why It Won
It wasn’t the colors. It wasn’t fancy animation. It was impact. Our dashboard turned chaotic, external data into operational action. We showed how to:
- Adjust campaign spend based on live sentiment and engagement
- Optimize publishing schedules by analyzing audience growth
- Identify high-performing content creators by ROI-per-post
- Benchmark performance across internal and public-facing metrics
We weren’t just visualizing data—we were predicting outcomes and shaping digital strategy.
Reflections: What This Dashboard Taught Me
Winning the award wasn’t the end of the story—it was a milestone that confirmed something I had long believed:
When you align the power of technology with the clarity of business purpose, transformation is inevitable.
Looking back, that dashboard wasn’t just a project. It was a movement. A turning point. A case study in what’s possible when creativity meets code, and insight meets action.
And it all started with a simple question: Can we do more with the data in front of us?
Yes. We can. And we did.
Would you like to see a demo of the dashboard or understand how to apply these practices to your own work? Let’s connect!
Categories
Contact us!
